I’ve written several posts that encourage readers to analyse past data in order to identify trends (see football prediction models). Data analysis is, of course, a fundamental skill if you’re looking to find new ways of earning from sports betting. But not everyone has the ability or time to do that.
If you’d like to…
- Analyse betting data without requiring any skills in Excel, or comparable program
- Calculate detailed analytics beyond your mathematical/statistical skill level
- Record and monitor your betting results more efficiently
- Improve your bankroll management strategy
… then the best solution I’ve found is a FREE product called Bettingmetrics.
Note: Bettingmetrics has been incorporated into a much larger project: Betting.com.
What Is Bettingmetrics? What Does It Offer?
Bettingmetrics is a browser-based “sports betting portfolio management suite” that enables you to easily monitor and analyse your betting activities. The automated ‘metrics’ provided by the software give a detailed insight into your historical performance.
Additionally, Bettingmetrics acts as a social hub where bettors can share their results, exchange useful information and buy & sell tips. So if you have a proven track record, then others may want to follow you.
The concept of Bettingmetrics won a startup accelerator program in London.
Let’s take a closer look at the Bettingmetrics software and its features.
The Bet Tracker
If you treat your betting activity as an investment — like Trademate Sports — then you’ll need to record and monitor your PnL and ROI. I’ve covered this skill in my post Calculating The Expected Value (EV) Of Your Bets.
But if you want the ability to analyse your results in greater detail, without the manual labour, then you can feed your data into the user-friendly Bettingmetrics interface via the ‘Bet Tracker’.
The bettingmetrics ‘bet tracker’ interface
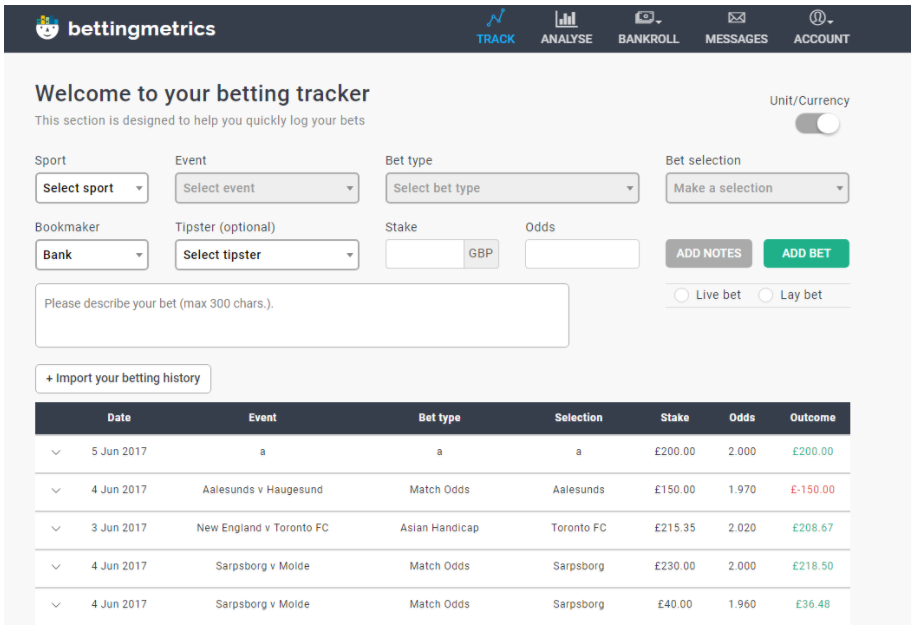
The first advantage of entering your betting data into the Bet Tracker is that you don’t need to maintain your own Excel spreadsheets — which are prone to errors, and loss of data. Simply select your criteria and click “add bet”.
What Data Can I Enter Into the Bettingmetrics Bet Tracker?
The bet tracker enables you log the following:
You also have the option to add notes to your bet. For example, you might want to recall the reason you placed your bet, or any issues you encountered at the Bookmaker.
Configurability
Whilst the Bet Tracker interface is simplistic, it does allow you to change the units. If you prefer viewing units stakes as opposed to currency, then you can quickly switch between the two from the switch located in the top right corner.
Automated Results
Once you’ve logged a bet in the Bet Tracker Bettingmetrics takes care of the rest. It calculates your PnL automatically using the results it gathers from the Betfair API. This is an excellent feature, and one that isn’t easily integrated into a ‘homebrew’ Excel spreadsheet or database system. It saves you so much time.
The only snag is that you’ll still have to manually settle up any custom bets which weren’t available from the suggested events available in the system. Bettingmetrics are however working towards adding more API data to the tracker in the near future.
Betting History
So what about all your historical data, prior to using Bettingmetrics ?
Well, another great feature of Bettingmetrics is the ability to import your entire betting history with just 2 clicks. You can import your Betfair exchange data and immediately benefit from the analytics. The button for this is labelled “import your betting history” in the above image.
Granted this feature currently only works for Betfair data. But Bettingmetrics are aiming to enable users to synchronise their Bookmaker accounts with the system, by automatically feeding their betting data into the tracker. This feature is to be seen, though. I imagine many Bookies will object to enabling punters to monitor and improve their betting through data analysis!
Analytics
Data is worthless without analytics. And lack of available analytics is one of the stumbling blocks for bettors. If we had a greater understanding our past mistakes or successes, then might we bet with more reason in the future?
Maybe. Surely it does no harm.
Bettingmetrics have developed tools that allow punters to analyse their own betting performance in order to improve going forward.
Monitoring your results — without bias.
What Can You Analyse Using Bettingmetrics?
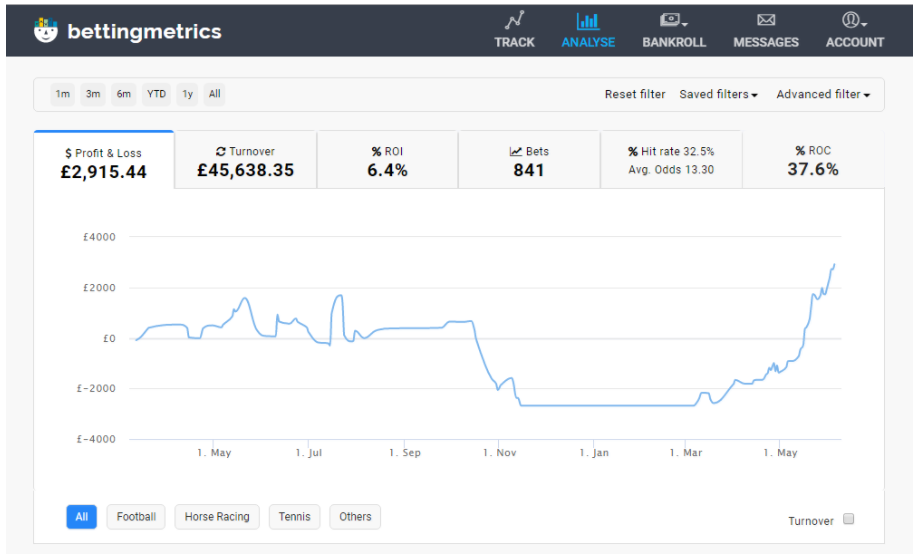
The Bettingmetrics analytics section shows you a simple snapshot of your betting results. Using the quick filter you’ll be able to check:
- Profit & Loss
- Turnover
- ROI
- Number of bets
- Hit rate and average odds (see Strike Rates)
- ROC (Return On Capital)
You can also add a sub graph. For example, you might want to compare the overall PnL to Turnover to check for a relationship between the two. What you’d want to see in this case is that the PnL is linear, and increases steadily with more Turnover (total stake).
The data comparisons can be configured to span different data items, time periods and sports.
Applying filters to analyse a subset of your betting results

Your betting results are shown in a classic table format.
All items in the table are editable. So adjustments can be made to individual bets, and all other calculations will be automatically updated (e.g. PnL, ROI etc).
Detailed (summary) analytics from bettingmetrics

Bettingmetrics’ automated analytics show your performance using simple and recognisable data presentation techniques — see the pie charts and bars shown in the above image. The bars are interactive, so clicking them applies an extra filter to the data. You can filter further — by sport, bookie or tipster — using the tabs in the middle section.
Advanced Filters
The advanced filters allow you to delve a little deeper into your results.
Use it to filter by variables such as the ‘odds range’ and ‘stake’ to determine your PnL, Turnover and ROI under those restrictions. Up to 3 data series’ can be visualised on the same graph.
The Bettingmetrics advanced filter — selecting your criteria
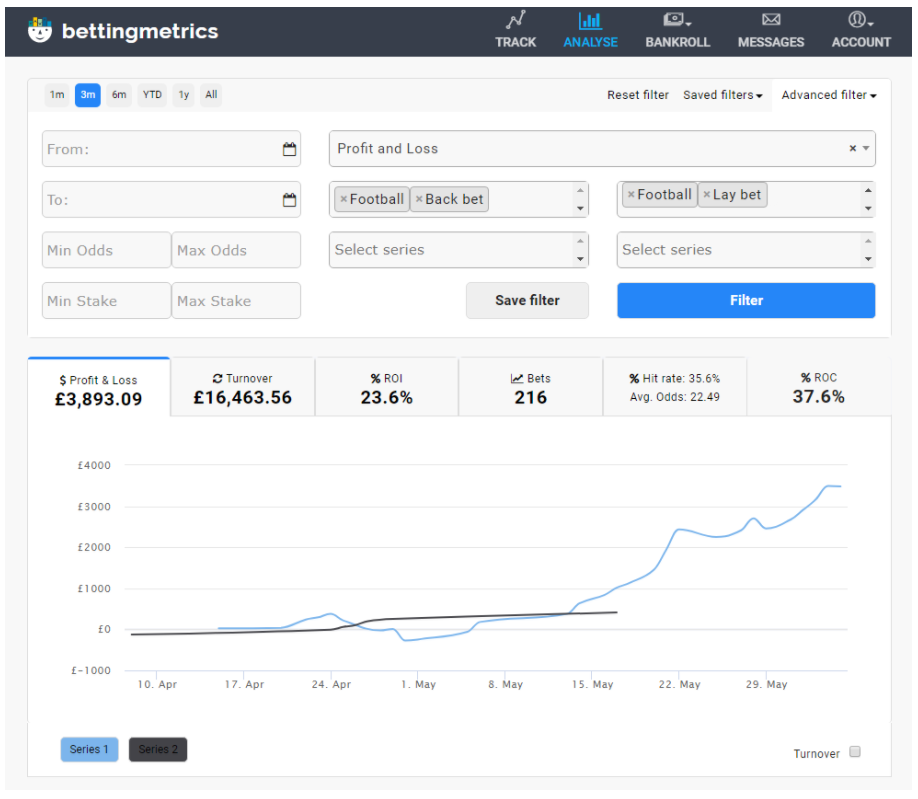
In the above example, the 2 selected ‘Series’ are showing a profit (so far). Series 1 has made significantly more than Series 2.
The Bettingmetrics advanced filter — Hit rate & Average Odds (example)
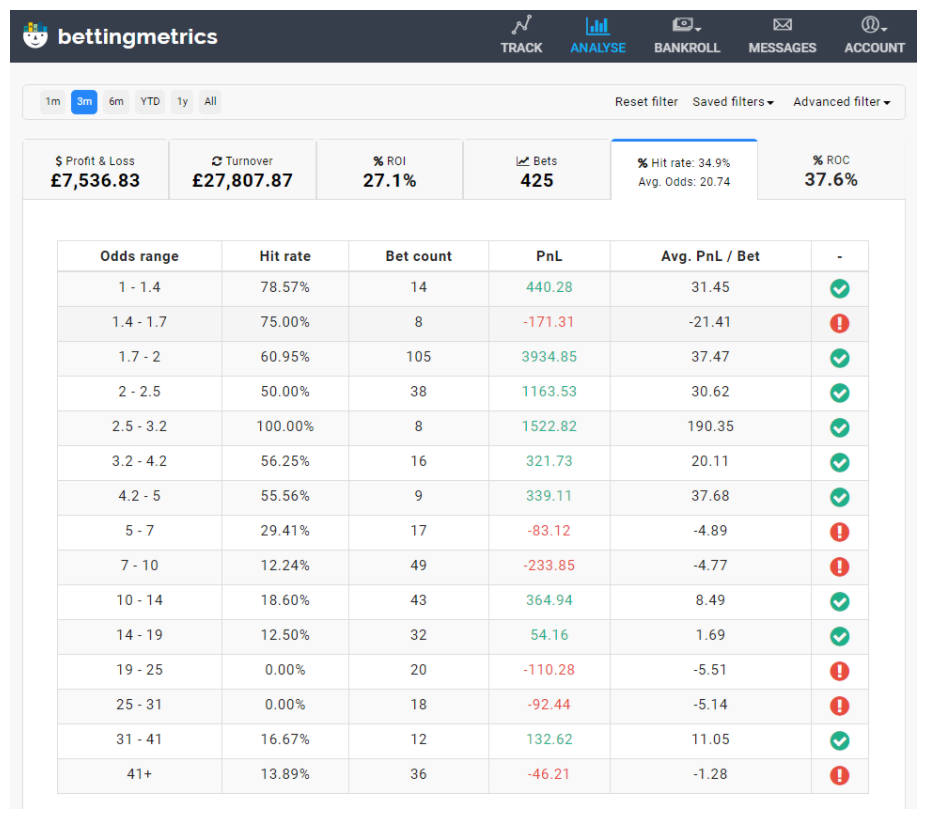
In the above example I’ve shown the Hit Rate/Average Odds tab. This reveals how the bets performed within odds ranges. In efficient markets you’d expect the lower odds to have a much higher hit rate (see strike rates).
Warning: I personally wouldn't fixate on odds ranges. Over a lot of data it seldom identifies a winning trend.
How Useful are the Bettingmetrics Analytics?
In general the analytics aren’t that advanced. Some bettors achieve a comparable level of analysis using Excel. Plus your own spreadsheet offers greater flexibility. Therefore the question ought to be: are you capable of replicating this level of analytical detail yourself?
If not, then a tool like Bettingmetrics will quickly deliver the much-needed insight into your betting performance with very little input. This could be invaluable to your improvement as a bettor.
Important: you need to collect a significant sample size to avoid forming weak or unfounded assumptions. Check out my post: The Paramount Importance Of Sample Size In Betting Analysis
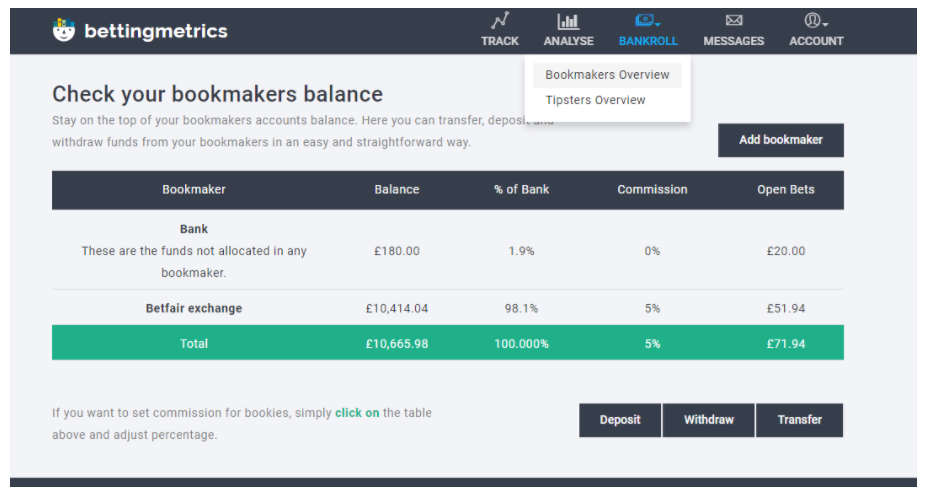
Bankroll
The bankroll section of Bettingmetrics allows you to add Bookmakers to your portfolio and enables you to check:
- The current balance
- Open bets
- Total deposited
If you deposit or withdraw funds to/from any given Bookmaker, Bettingmetrics uses your data input to adjust the balances accordingly.
‘Bookmaker’s overview’ on bettingmetrics
The bankroll section also includes another section: the ‘Tipster’s Overview’.
If you follow one or more tipsters/strategies then you can view a quick summary of their performance. This includes the Tipsters’:
- Current Balance
- Open bets
- Units (if he uses them)
- Risk (stake per unit)
Importantly you’ll be able to check if the Tipster has distributed his funds effectively, and whether he has any unallocated funds in his bankroll.
‘tipster’s overview’ on bettingmetrics

So is Bettingmetrics for you?
- It enables you to easily monitor — and rapidly produce — insightful analyses on your betting data.
- The automated features, in particular, are superb. They’ll save you ample time in manual data entry/collection.
- The benefits are somewhat limited if you’re experienced in Excel or database software development.
- Bettingmetrics‘ algorithm is constantly being improved to provide more features and complex insights in the near future.
- It’s currently free. So there’s nothing to lose!
Further Reading
Forget What You’ve Won Or Lost. Verify That Strike Rate.
The Basics Of Creating a Football Prediction Betting Model
Where Can I Find Free, Detailed Football Stats? (Football Analytics)
The Paramount Importance Of Sample Size In Betting Analysis